.
.
.
[Author’s Note: If you didn’t read my piece from August entitled Anaheim’s 25.25 District Maps, Part 1: The Maps and Their Stats, now — given the Brandman-Murray motion to have the Council go back into pile and look at the maps that the retired Judges on the Advisory Committee on Electoral Districts and everyone who spoke at its last few meetings finally rejected — now would be a good time to do so. It includes all of the maps that are not addressed in this diary, as well as some that are.]
1. Introduction to “Packing” and “Cracking,” Using the Second-Worst Map Submitted to the City This Year
Councilwoman Kris Murray wondered several times during the discussion at last week’s City Council public hearing on districting how anyone could argue that Latinos could be better served by one district where they were the majority of potential voter pool than two such districts. I’ll happily explain that to her — despite that the report of the smart, dispassionate, and hard-working panel of retired judges on the Advisory Committee on Electoral Districts already spelled out the answer to her in the report that she was supposed to have read before last week. (I’m always happy to help.)
The problem, in voting rights litigation — with which she is soon likely to become familiar — is with something called “packing” and its opposite, “cracking.” It’s probably easiest to explain with an example — such as the second-worst map submitted to the City earlier this year, by Michael Dresser, which contains the single best district for Latinos of any one submitted. It that seems like an irony to you, it isn’t: that one fantastic Latino district allowed him to make the other five into the worst set of second- through sixth-best districts possible, because he crammed — “packed” — about as many Latino voters as possible into one district. Here’s his map, taken from that very useful link above:
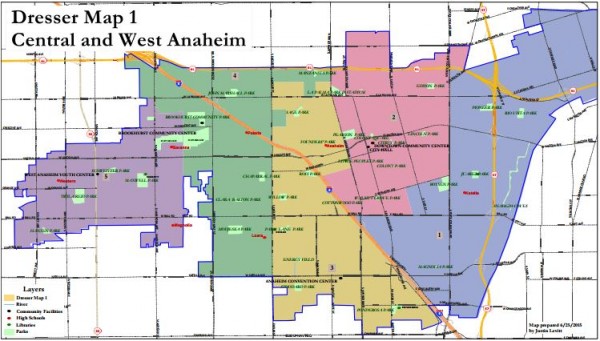
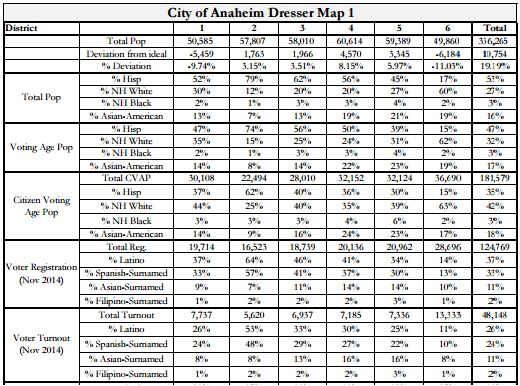
Find the third of the five big rows in the first column that says “Citizen Voting Age Population” — essentially, the “electoral pool.” That will give you the “CVAP” totals for all of the eligible voters in the district, and then in the rows beneath it just for Latinos (“Hispanics”), Non-Latino whites, Blacks, and Asian-Americans. Across the top, you’ll see the numbers 1-6, corresponding to the six districts this person submitted. At right are the totals for the entire city.
District 2 in Dresser’s map, which appears in pink, is 79% Latino! Of people of voting age, it’s 74% Latino. Among citizens of voting age — “CVAP,” the pool of eligible voters (not accounting for felons, the profoundly mentally disabled, etc.) it’s 62% Latino. Those figures are substantially higher than any other district in any other submitted map.
As a result of this packing of so many Latino voters into one district, there aren’t a lot to go around to the other five. District 4, in green, has a 1% Latino majority — but that’s only 36% to 35% Non-Latino Whites, with 24% of the eligible voters being Asian-American. Not a particularly good district for Latinos. District 3 has 40% Latinos and 40% Non-Latino Whites, with 16% Asian-Americans. Also not a good district for Latinos, whose voting rate tends to be lower and who tend to stand in opposition to other ethnic/racial blocks of voters. Could it have been possible to create a second district with a more substantial majority out of the next three most-Latino districts, 1, 3, and 4? I’d be quire surprised if not. And not putting Latinos in the same district where it could give them political power — usually around 50% — when it doesn’t create major problems for the other district is what’s called “cracking.”
(Note one other small thing before we move on. Do you see where District 4, just west of Euclid and in green, reaches into east of Euclid to pick up some territory from District 3 in yellow? What’s going on there — and especially with that extra southern turn from the very top? None of it is necessary for population balance — in fact, it pushes District 4 further out of balance? One wonders, did Dresser raid some people and put them into District 4 to keep them out of District 3? If so, why? That’s the sort of sneakiness that bears watching.)
2. How Only Two Loaves Could Be Worse for Latinos than One Loaf and Two Almost-Full Loaves
Now that Councilwoman Murray and the rest of us are on the same page, I can answer her question. Two majority districts can be worse for Latinos (or anyone else, including whites) than one if creating them lowers their voting power through “packing” and/or “cracking.”
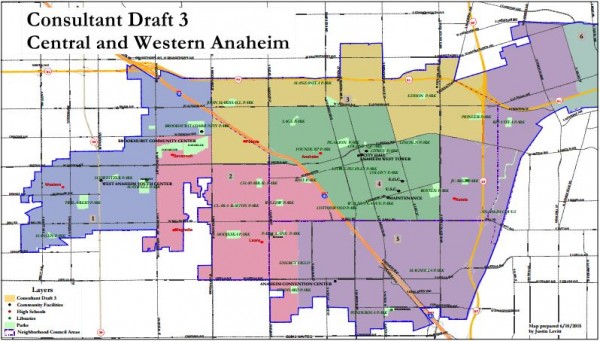
Councilman Jordan Brandman — illegally, by the way, but more on that another time — proposed a motion seeking to limit the maps that the Council would consider to those with two Latino electoral majority districts. (You can read his prepared statement where he spelled out “his” thinking here.) So, for now, we’ll look in depth only at maps with that characteristic. Brandman’s motion would narrow the universe of possible maps down to 16 — 7 of them produced by the City’s Consultant, Justin Levitt, who (like City Attorney Michael Houston) is being advised by former County Counsel Ben DeMayo, who advised the County Supervisors on their redistricting — which some criticized as “gerrymandering” — after the 2010 Census.
With one exception, the 16 maps that Brandman wants to limit the Council to consider all have the same flaw: they lock Latino voters into a situation where they generally have a very good chance in two districts, but very little chance in the other four. That locks Latinos into the minority position on Council — even IF they have a sympathetic Mayor. If they don’t, and if non-Latino voters stick together in opposition to Latinos, then the effect of the Council’s choice of maps would be to place Latinos — who are already a majority of the City’s population — in a 5-2 SUPERMINORITY on the City Council! And that’s a big reason why the plan of this Council, which has been generally hostile to Latino interests, will get smashed once it goes to court. (And it will go there.)
I wrote something relevant to our current situation in this post — it’s the last paragraph in Section 3, entitled “The Gagne Map and the “Third-Best Latino District” Principle” — that bears repeating now. It shows exactly where Brandman’s proposal goes wrong, using Benita Gagne’s map (a mild and well-intentioned revision of Consultant Map 1) as an example:
The judges — rightly, in my opinion and that of most (though not all) of the Latino activists involved — believed that creating four Latino minority districts out of six did not pass the “good optics” test for districts that were, after all, being drawn to pursue the settlement of a lawsuit over Latino voting rights. Anaheim could easily support one Latino majority and two strong to middling Latino plurality districts — and, if it could, then it should. This is not “cheating in favor of Latinos” as some would have it; it’s giving a group that has historically been massively underrepresented in Anaheim a fair shot at coming near to representation by a Council proportionate to its fraction of the voting pool. The Gagne map was not wrong (and certainly not ill-inentioned) in its conception — but after much deliberation the judges determined that it was not the best way to assure a fair voice for Latinos in Anaheim. While Gagne has argued persuasively that the choice between a “2 Latino Majority and 4 Latino Minority” map and a “1 Latino Majority, 2 Latino Plurality, and 3 Latino Minority” map is a political one best left to the Council, this decision actually goes to the heart of the remedy sought in the OCCORD lawsuit and so it is the prime example of what should not be left to the Council! The judges have considered the question and made their firm recommendation. Implicit is that recommendation is that the strength of the third-best district for Latinos is key.
The strength of the 3rd-best district is indicated for each map below by the color of the words “3rd-best” in its bottom line. Any map with more than a 5-point margin of Larinos vs. Non-Latino Whites in the third district is red; margins of between 3-5 are brown; margins of 1-2 are amber; margins of 0 to -1 are green (with negative numbers indicating a Latino CVAP minority) ; margins of -2 to -3 are blue and margins of more that -3 — more than a three-point Latino CVAP disadvantage in the 3rd-best district for Latinos, that is — are purple.
Links to the maps and statistics on the City’s site can be found by clicking on each one’s title. The maps themselves are at right.
3. The ‘Two Latino-Majority District’ Maps
District 4 (largely overlapping Recommended Map #3): 54% Latino to 31% Non-Latino White
District 5 (largely overlapping Recommended Map #5): 52% Latino to 34% Non-Latino White
3rd-best (District 3, largely overlapping Recommended Map #4): 37% Latino to 40% Non-Latino White
 Consultant Map 2 [Towards Which Brandman Says He Currently Leans]:
District 3 (overlapping Recommended Map #s 3, 4, & 5): 51% Latino to 31% Non-Latino White
District 5 (overlapping Recommended Map #s 3 & 5): 50% Latino to 34% Non-Latino White
3rd-best (District 4, overlapping Recommended Map #s 1, 2, & 3): 42% Latino to 37% Non-Latino White
District 4 (overlapping Recommended Map #s 3, 4, & 5): 55% Latino to 32% Non-Latino White
District 3 (overlapping Recommended Map #s 2, 3, & 5): 52% Latino to 32% Non-Latino White
3rd-best (District 5, overlapping Recommended Map #s 4 & 5): 39% Latino to 40% Non-Latino White
 Consultant Map 3 8/20 Revision (3R):
District 4 (overlapping Recommended Map #s 3, 4, & 5): 54% Latino to 32% Non-Latino White
District 5 (overlapping Recommended Map #s 3 & 5): 51% Latino to 34% Non-Latino White
3rd-best (District 3, overlapping Recommended Map #s 3, 4, & 5): 37% Latino to 39% Non-Latino White

District 4 (overlapping Recommended Map #s 3, 4, & 5): 56% Latino to 30% Non-Latino White
District 3 (overlapping Recommended Map #s 1, 2. 3, & 5): 52% Latino to 32% Non-Latino White
3rd-best (District 5, overlapping Recommended Map #s 4 & 5): 38% Latino to 42% Non-Latino White
 Consultant’s 8/20 Revision of Chuchua 4
District 3 (overlapping Recommended Map #s 3 & 4): 55% Latino to 30% Non-Latino White
District 5 (overlapping Recommended Map #s 3, 4, & 5): 51% Latino to 35% Non-Latino White
3rd-best (District 4, overlapping Recommended Map #s 3, 4, & 5): 37% Latino to 39% Non-Latino White
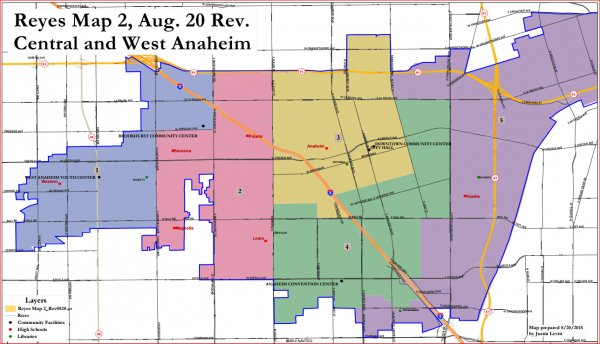 Consultant’s 8/20 Revision of Reyes 2
District 3 (overlapping Recommended Map #s 3 & 4): 51% Latino to 33% Non-Latino White
District 4 (overlapping Recommended Map #s 3, 4, & 5): 51% Latino to 33% Non-Latino White
3rd-best (District 5, overlapping Recommended Map #s 3, 4, & 5): 41% Latino to 40% Non-Latino White
Disqualified on criterion of equal population

District 3 (overlapping Recommended Map #s 1, 2. 3, & 5): 54% Latino to 32% Non-Latino White
District 4 (overlapping Recommended Map #s 3 & 4): 51% Latino to 30% Non-Latino White
3rd-best (District 3, overlapping Recommended Map #s 4 & 5): 41% Latino to 40% Non-Latino White

District 3 (overlapping Recommended Map #s 1, 2. 3, & 5): 54% Latino to 32% Non-Latino White
District 4 (overlapping Recommended Map #s 3 & 4): 51% Latino to 30% Non-Latino White
3rd-best (District 3, overlapping Recommended Map #s 4 & 5): 41% Latino to 40% Non-Latino White

Two LCVAP majority districts, undivided landmark district
District 3 (overlapping Recommended Map #s 3, 4, & 5): 52% Latino to 32% Non-Latino White
District 5 (overlapping Recommended Map #s 3 & 5): 50% Latino to 36% Non-Latino White
3rd-best (District 4, overlapping Recommended Map #s 1, 2, & 3): 39% Latino to 38% Non-Latino White
[Note that this next map was drawn to demonstrate to the judges that a map that had two Latino CVAP majority districts and split up the so-called “landmarks district” — the two criteria that they said that they wanted at one point — would, if its western border was Euclid, look absolutely awful as it reached up and down to collect Latinos and excude non-Latinos. It wasn’t intended to be chosen, but to get them to change their criteria — which, whether for this reason or others, they did.]

Two LCVAP majority districts, split landmarks. Ugly as sin.
District 3 (overlapping Recommended Map #s 3, 4, & 5): 53% Latino to 32% Non-Latino White
District 5 (overlapping Recommended Map #s 3 & 5): 52% Latino to 33% Non-Latino White
3rd-best (District 4, overlapping Recommended Map #s 1, 2, & 3): 38% Latino to 40% Non-Latino White

District 4 (largely overlapping Recommended Map #3): 54% Latino to 32% Non-Latino White
District 5 (largely overlapping Recommended Map #5): 52% Latino to 34% Non-Latino White
3rd-best (District 3, largely overlapping Recommended Map #4): 37% Latino to 39% Non-Latino White

District 3 (overlapping Recommended Map #s 2, 3, & 5): 57% Latino to 31% Non-Latino White
District 4 (overlapping Recommended Map #s 3 & 5): 55% Latino to 32% Non-Latino White
3rd-best (District 5, overlapping Recommended Map #s 4 & 5): 43% Latino to 40% Non-Latino White

District 3 (overlapping Recommended Map #s 3, 4, & 5): 54% Latino to 32% Non-Latino White
District 4 (overlapping Recommended Map #s 3 & 5): 52% Latino to 32% Non-Latino White
3rd-best (District 5, overlapping Recommended Map #s 2, 3, & 5): 38% Latino to 41% Non-Latino White
District 5 (overlapping Recommended Map #s 3, 4, & 5): 54% Latino to 33% Non-Latino White
District 3 (overlapping Recommended Map #s 2, 3, 4, & 5): 52% Latino to 32% Non-Latino White
3rd-best (District 4, overlapping Recommended Map #s 2, 3, 4, & 5): 40% Latino to 38% Non-Latino White

District 5 (overlapping Recommended Map #s 3 & 5): 51% Latino to 33% Non-Latino White
District 3 (overlapping Recommended Map #s 1, 2, 3, & 4: 50% Latino to 32% Non-Latino White
3rd-best (District 4, overlapping Recommended Map #s 3, 4, & 5): 50% Latino to 38% Non-Latino White
4. TOTAL NUMBERS OF “3RD-BEST LATINO CVAP DISTRICTS” IN EACH CATEGORY
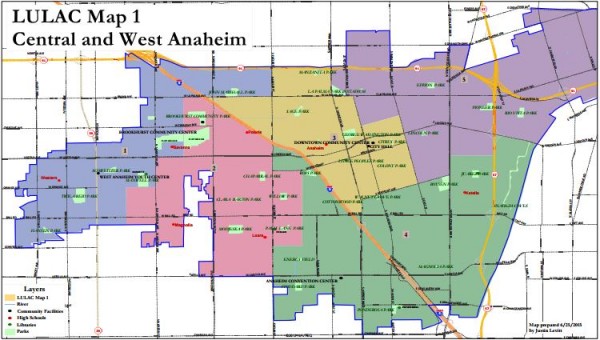
Red (>5%): LULAC 2
Brown (3 to 5%) Consultant 2, Gallegos
Amber (1 to 2%): Consultant Revision of Reyes 2, Brown 1, Brown 2, Chuchua 5, LULAC 1
Green (0 to -1%): Consultant 3
Blue (-2 to -3%): Consultant 3R, Consultant Revision of Chuchua 4, Chuchua 7, Gagne, Kim
Purple (< -3%): Consultant 1, Consultant 4
Essentially, the “warmer” colors have the best 3rd-best Latino CVAP Districts and cooler ones have the worse. Only three maps have more than a 2% advantage for Latinos over Non-Latino Whites — and all three of them do it through some weirdly shaped districts. The best of them, LULAC 2, is the map just above — and it’s fair to say that it looks highly gerrymandered. (Yet this was the map that Kris Murray praised in noting that there was one map that had three Latino-majority districts — so by that standard this would be the winner.)
The Consultant 2 map creates some districts that appear nowhere else, such as the green, Pennsylvania-shaped District 4 that combines sections of the City that no one else considered “partners” and the district kist below it that stretches from Lincoln and Brookhurst to southeast of Disneyland — another highly creative but mystifying connection. It also divides up the Colony into THREE districts — not dividing the Colony was one of the few things that almost everyone could agree on at the start of the process — and seems to intentionally crack the heart of the Latino areas.
The Gallegos map is the best of the three — it looks gerrymandered, but not nearly as much as LULAC 2, and it’s not nearly as blind to communities of interest as Consultant 2 — but it also creates the weakest “third district” at 3%. Every other one of these 13 maps — five of them, including the two worst 3rd Latino Districts, by the Consultant — gives either a very slight advantage to Latinos or a modest to big disadvantage.
How does this compare to the maps that Councilman Brandman just threw in the trash?
5. The One Latino CVAP Majority District Maps Give Latinos a Fighting Chance at Three of the Six District Seats
In this final section, I’m going to grab most of the maps that Councilman Brandman just tried to eliminate from consideration, just to get a sense of them. (I’m eliminating Dresser because his second-best district is only in “Amber.”) We’ll use the same color scale as before.
Red (>5%): Chuchua 2, Chuchua 3, Chuchua 6, Chuchua 9, Chuchua 10, Lugo, Mills 1, Mills 2, Reyes 1, Reyes 2 (which became “The People’s Map” and then “The Recommended Plan”)
Brown (3 to 5%): Caughman
Amber (1 to 2%): Adelekan, Chuchua 4, Chuchua 4R, Chuchua 8, Duron 2, Henninger, Warner
Green (0 to -1%): [zero]
Blue (-2 to -3%): [zip]
Purple (< -3%): [zilch]
To underline the point: every single map that doesn’t have two Latino CVAP majority districts has at least a Latino CVAP plurality in its third-best district. Seven of them have a plurality of 1-2%, one has a plurality of 4%, and the other TEN all have a majority of 6-11%. And when the next CVAP numbers come in, most of these maps MAY WELL have two Latino CVAP majorities as well!
THAT is how Jordan Brandman claims to be “protecting” Latinos by throwing out every district that doesn’t pack Latinos into two CVAP majority districts right now: he is protecting them from having a decent fighting chance of not being in the minority on the City Council!
The Judges’ Advisory Committee of Electoral Districts understood this — and tried to tell the Council in a report that doesn’t seem to have been read. The people drawing the maps understood this. Mayor Tait and Councilman Vanderbilt already understand this. The citizens of Anaheim are going to understand this. It’s time for Councilman Brandman, Councilwoman Murray, and poor Councilwoman Kring, who is being dragged along into this unwittingly, to understand this too.
Because do you know who else is going to understand this?
THE COURTS — AND SOONER THAN THE COUNCIL MAJORITY MAY THINK!
Are there any estimate on how much scrapping the peoples map and re-doing it all over again will cost the city? I cant see ho this is going to be a low cost effort or even necessary and or useful to anyone other than the promoters.
I don’t think that simply voting to substitute in another map would be all that expensive, except that there may be some additional costs in and the demographer and possibly Ben DeMayo.
The expenses would probably involve the prospect of litigation, and possibly fines from the court if they resist any sort of court order – which, with these people, you never know if they care. Then of course there could be costs associated with “social unrest” — more police over time, that sort of thing. And then, there is always the potential cost of a recall election. So I don’t think that the direct costs would be that high, but the indirect costs may be pretty substantial.
yeah. alot of nonsense at any rate
This is gerrymandering 101. Thanks for taking the time to walk us through it, Dr. D.
Paging, SQS, your condemnation of Jordan Brand-name, by name, is long overdue. Allowing him to use your name to run for Congress TO REPRESENT THESE PEOPLE says much more about you than it does him.
SQS has condemned the action. But, Only the action.
Swing and a miss then.
But come on: “I endorse this guy to represent you in Congress even though he completely screwed you over in what may be the most important discussion impacting you and your neighbors for a generation.”
Doesn’t get much weaker than that. Hope I’m mistaken.
An argument can be made that “Silence equals consent”. But, she went halfway. So its kind of a wobbler.
Wait. I thought her statement was coming today. Where did you hear this, Paul? She told me something different over the weekend, she had promised to wait till some staff person got back today to make her statement.
Poseidon Redux.
It did come today and it condemned the action and the city council but not the one who shall not be named outright.
Is it possible to push the Peoples Map by citizen initiative?
Just as ‘possible’ as a recall.
Houston says absolutely not. So … maybe.
I think that the legitimate concern is whether it could be done — including election certification — in time. At a minimum it would cut things very close.