.
.
.
There is a big lesson in these feathers falling on a football field — and if could explain a deficiency in this year’s political polling.
You Can Skip This Part of the Introduction
The site 270toWin.com not only allows you to create your own electoral college forecast map, but it also allows you to see all of the major prognosticators maps on one page, which is an enormous timesaver. (I’m highlighting results for Pennsylvania, Arizona, and Omaha (“NE2”) because I contend those are the only three swing contests that could be decisive — presuming that the consensus is right about Biden winning Wisconsin and Michigan. I also sweep all of the states “leaning” one way or the other into that candidate’s column, despite that these prognosticators will use that uncertainty as their excuse if they’re wrong, because frankly that’s how they present this information and that’s how it’s taken.)
Go to that page — last checked around 4:00 pm PT — and you’ll see:
- the aggregate forecasters’ map (Biden 290-163; wins AZ/PA; NE2 among 85 undecided)
- a map based on current polling (Biden wins 278-125; wins PA; AZ & NE2 among 125 undecided)
- a polling map without tossups (Biden wins 351-187; wins PA, AZ, NE2)
- Larry Sabato’s Crystal Ball map (Biden wins 290-163; wins PA, AZ, NE2)
- Cook Political Report map (Biden wins 290-163; wins PA, AZ, NE2)
- Inside Elections map (Biden wins 350-125; wins PA, AZ (“tilt” only), NE2); 63 undecided (or including 71 tilts, 134)
- The Economist map (Biden wins 334-164; wins PA, AZ, NE2; 40 undecided)
- FiveThirtyEight map(Biden 305-163; wins PA, AZ, NE2; 70 undecided)
- Politico map (Biden 279-179; wins PA, NE2, AZ tossup; 80 undecided)
- PredictIt Markets map (Biden 305-233, 26 of which are blue “tilts” (AZ, NC) and 15 of which are red tilts (GA, ME-2); Biden wins PA, NE2)
- Princeton Election Consortium map; Biden 351-181, 6 tied; wins PA, AZ, NE2
- Decision Desk map (Biden wins 351-163; wins PA, AZ, NE2; 24 undecided)
- JHK Forecasts map (Biden wins 351-163; wins PA, AZ, NE2; 24 undecided)
- CNN 2020 Electoral map (Biden wins 290-163; wins PA, AZ, NE2; 85 undecided)
- NPR 2020 Electoral map (Biden wins 279-125; wins PA, NE2; AZ among 134 undecided)
- US News map (Biden wins 279-163; wins PA, NE2; AZ among 96 undecided — same as NPR but gives Texas to Trump)
Only four maps — the polling map, Politico’s, and NPR’s and US News’s, are even remotely reasonable — and none of them is cautious enough.
Definitely Read This Part of the Introduction
If you didn’t read the first part of the introduction, I summarized the totals of each of the 16 maps covered by the forecasting website 270toWin — and concluded that only four of them were even remotely reasonable, but that none of them are cautious enough.
All 16 maps grant Pennsylvania’s 20 Electoral Votes to Biden. Those 4 are the only ones in which Biden’s loss of those Electoral votes would cost him the election. Four more would give him exactly 290 electoral votes, meaning that the loss of Pennsylvania would leave him with exactly the number of EVs he needed to win. All but one of those, however, also gave him Omaha’s lone electoral vote; the other one gave him both Pennsylvania and Arizona, rendering Omaha unnecessary.
As I argued in the precursor to this post — the one illustrated with a tiny Biden as a blue Sisyphus pushing a boulder twice his height up a, ever-steeper mountain — Biden has a pretty sure hold on 258 Electoral votes — if you believe that he really does have Nevada, Minnesota, Wisconsin, and Michigan in hand. All of the forecasters accept that — and (relying on the Fivethirtyeight”s polling aggregation, showing them between a 5.9% and 9 point advantage — so will I.
I — and all 16 forecasts — may be wrong in that. Maybe Biden will lose Nevada and Wisconsin. If he still won Arizona and Omaha, that would mean that he’d have to win something like Pennsylvania or Ohio to win. Or, I could be wrong in not believing that Biden has more than an even chance in any of the races where his polling lead is less than 3% — Arizona, Florida, North Carolina, Georgia, let alone supposed swing states like Ohio (tied up), or Texas, and Iowa, where Trump has slight leads.
It’s also possible that Biden will win one or more of those states — that’s how you get forecasts of Biden winning with 350 or more Electoral Votes — but in that case (except if he only wins little Iowa) it means that he’ll win the Election without further worry. But we don’t have to prepare for that eventuality; it doesn’t guide our actions. We have to prepare for the sort of maddeningly agonizingly close loss that we could have done something about — and we should be doing that “something” right now.
Biden has 258 relatively secure Electoral Votes. Pennsylvania gives him 278, which would be great — but we can’t count on that (more on which below). Biden’s second viable path to the Presidency is to win Arizona, which would create a 269-to-269 tie (in which Trump would probably win the tiebreaker) AND to win Omaha — and then pray for no bribed faithless Electors.
Push forward the vote in Pennsylvania, Arizona, and Omaha. Maybe in Nevada, less likely in Wisconsin. But WE are HERE — Arizona is our neighbor. Let Massachusetts and New York take care of Pennsylvania; let Chicago take care of Omaha. We need to win Arizona.
But there’s another problem, which I address for the rest of this essay:
The polls are probably wrong.
What Do You Think You’re Forecasting, Anyway?
The reason to worry about the polls that has less to do with the falling feathers is that there’s a limit to what pollsters can actually accomplish. By this time is the cycle, they have already switched from polling all voters to polling likely voters — those who fully intend to vote, or even those who have already voted — because that will give a better sense of what the actual electorate will look like.
It’s a good idea, but it depends upon a hidden assumption: that those who believe that they will vote will actually be able to vote. While mail-in voting, drop boxes, and early voting have made it likelier that anyone who wants to vote can vote, but it’s far from certain.
Regarding mail-in voting, this administration and its state counterparts have made a point of:
- casting doubt on the certainty that mail-in voting will arrive in a timely manner, by messing with the US Postal Service, its work schedules, and its equipment
- trying to prevent the counting of mail-in ballots that arrive (or are even counted!) after Election Day
- … and preventing any advance processing of ballots (signature comparisons and the like) until Election Day or just before — while at the same time demanding that the count be complete on Election night
- segregating ballots properly cast according to relied-upon law, so that they can be tossed out by the Supreme Court if they would make a difference
- calling for draconian interpretation of election laws that will disqualify voters for the smallest technical errors without giving them the chance to cure the problem
- and I’ll add the rest when I remember it.
How about ballot drop boxes? Texas’s Governor tried to limit drop boxes to one per county — which is fine for small rural counties (and most Texas counties are really small), but more difficult for a place like Harris County — which is the home of 4 million people. This heinous order was, I believe, recently overturned — but it was too late for many people to include that “leniency” in their plans. And, of course, here in OC, the state Republican Party tried to pass off fake drop boxes (without the proper safeguards) as the real thing — and looked forward to taking the state to court until someone apparently explained the law to them and they slunk away with their boxes (presumably surrendered to the Registrar’s office.
Early voting? Barred in most swing states — or limiting times and locations that make them highly inconvenient for voters who lack free transportation, time, money, or full abilities.
Well, you can always vote in person! But of course, Covid-19 makes that an issue for older and less healthy voters — the latter especially common among minority communities — and then you have Proud Boys threatening to become unauthorized poll watchers and the Michigan militia demanding to bring their guns to the polls. (Maybe in case a grizzly bear shows up?)
So tell me — even as hyped up as Democrats in particular are this year, do you think that it’s reasonable to believe that all likely voters are going to be able to vote, or that if they do vote that their votes will be counted?
Me neither. The question is what the “shrinkage” will be.
Now, pollsters will say, if pressed, that figuring out whose votes will ultimately count is not their job. They’re just telling us what the people who believe that they will vote or have already voted (with whatever degree of success) planned to do.
And, really, that IS the best that they can do. (It’s not the best that I can do, though, hence this story.) They just don’t admit it and they strain to give you the opposite impression. But one question it absolutely does not answer — which is something you absolutely would not get from looking at that “electoral-vote” page, is “WHO IS LIKELY TO WIN THE ELECTION?”, which is probably what you’re really interested in, both out of morbid curiosity and because maybe you’d like to do something about it if you weren’t complacent over every freaking forecaster saying that Biden already has over 270 Electoral Votes in the bag.
Something like getting information from the DNC about how to make GOTV calls into Arizona! (Contact me if you want to know how — and, if I know and trust you, I’ll set you up.)
Oh, Yeah, I Promised to Explain the Feathers!
OK, it’s an sign of erudition to tell you that, “you know, the Presidential Election is not one contest, it’s 51 different contests.” Erudite and true, sure — but it’s misleading. They aren’t fully independent contests, like flipping a fair coin or the rolls of a fair die.
Say you’re looking at the eight different contests where Biden has the smallest leads according to 538.com — that is, the ones after Nevada has given Biden 258 Electoral votes — to see which of those might put him over the top. Those are:
- Pennsylvania (5.1% lead = 96% chance to win 20 EVs.)
- Omaha (3.7% lead = 74% chance to win 1 EV)
- Arizona (2.9% lead = 70% chance to win 11 EV)
- Florida (2.1 % lead = 67% chance to win 29 EVs)
- Northern Maine (3.7% lead = 74% chance to win 1 EV)
- North Carolina (1.8% lead = 64% chance to win 15 EVs)
- Georgia (0.6% lead = 55% chance to win 16 EVs)
- Ohio (which is essentially tied) 49% chance to win 18 EVs.
And you could also go on to calculate the odds of winning states where Trump has a lead — 38% in Texas, 37% in Iowa, 15% in Montana, 8% in South Carolina, and so on — and they too contribute to the various ways that Biden can win.
Since Biden starts with a 49% chance of winning in Pennsylvania (uh … based on polling likely voters), you can add to that his other obvious path of winning both Omaha and Arizona: 74% × 70% = about 52%. That means that the likelihood of Biden’s losing both pathways to victory is 51% × 48% = about 25%, so his chances of winning one or the other of them is about 75%. And you can go on from there to calculate path like that for every conceivable state — and you’ll come up, as Nate Silver did, with Biden had about an 89% chance of victory.
We’ve already discussed one problem with that theory — that it’s actually only calculating the probability that people who could deliver 270 or more Electoral Votes believed that they would successfully vote for him. But there’s another problem: state electoral contests are not independent events! You can’t reasonably multiply them like I just did as if they were rolls of a die. The notion that you can is based on a theory of possible outcomes being what we call “normally distributed” — and here’s where the feathers come in. They teach us how we deal with uncertainty.
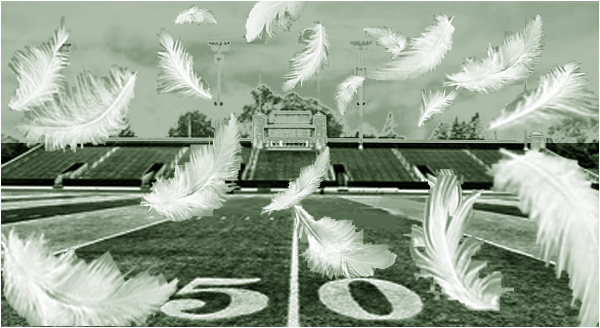
The Feather Scenario
Let’s say that the Rams are on the road playing the Seahawks, or the Eagles, or the Falcons — some team with a bird mascot. The air is perfectly still. And that team decides to celebrate the end of the game by dumping out a big bucket of feathers hoisted up in a crane high above the 50-yard line. (In the middle of the 100-yard field horizontally, in other words, for non-fans.)
The crane is perfectly placed and, by some magic one-by-one like paratroopers — the bucket it perfectly emptied. The feathers waft down lazily, some heading a bit right for some reason and others heading left. Can he predict how many will fall within a certain range?
Yes, we can — although we don’t know ahead of time what that range is. The spots upon which the various feathers fall would be expected to form a “normal distribution.”

The blue, red, and gold curves are all normal distributions centered on a midpoint that, in my “feathers” scenario, would be the 50-yard line. (They’re just spread out more or less widely around it.) But watch out for that green one! (I used this last April in discussing the Trumplague.)
So the distribution of feathers around the football field would end up looking like one of those distributions. (Note that while they look like physical piles, they aren’t — they’re numerical tallies of — in this case — how many feathers fell on what yard line.
Again, that we can have some confidence about how the feathers will be distributed around the field — despite that we could not make a good prediction of where any particular one would land — comes from the fact that we can treat them as identical objects (in the sense that differences in their physical forms give us no clue as to whether they’ll go left, right, or center) in an identical environment (meaning that we don’t understand the environmental factors that might affect a given feather’s travel to the ground.) We’d predict that all of them would land on the 50-yard line, but they won’t — and those deviations from our predictions are called “random error.”
The randomness of what we don’t understand about it all is what allows us to make good predictions about the nature of their distribution on the ground. Essentially, random errors cancel out. Back in politics, the chances the Biden does better in some states would be expected to be balanced out, in the long term, y Trump doing better in others.
But what is it that we don’t understand about variation of results? We’ll get back to politics in a moment — but for now, let’s imagine that instead there is a gentle, almost imperceptible, quarter of a mile per hour wind blowing from left to right. “What we don’t know we don’t know” turns out to be a systematic, or correlated, error. In making predictions, we can handle random error, but it’s systematic error that kills us.
For a long time, pollsters didn’t know how they had screwed up so badly in 2016. (If you want to read some of the stories about when and how they figured it out, I Googled it for you. Have fun.) For a long time, 538’s Nate Silver and Harry Enten argued that they told everyone that Trump had a chance of winning, and people just didn’t take it seriously enough. (Sound familiar?) Their answer was based in a theory that what they didn’t know about voters’ attitudes was just random error. It wasn’t.
Eventually, the profession figured out what they now think is the answer: a systematic error in who they polled. They didn’t take efforts to balance their polls based on educational attainment. Trump, who once said that he “loved uneducated people,” had good reason for that: they loved him a lot more than educated people did. The polls were skewed towards interviewing better educated voters — therefore center point of the polls were shifted to the left — like that green curve in the diagram above — and so we all thought that Hillary was going to win … until it was too late.
(It’s not yet too late. Did I mention calling Arizona?)
Applying Feathers to Our Predictions
This year, I submit, there is another source of systematic error — all of the difficulties that people (very disproportionately Democrats) will have getting to vote and getting voters that would surely count in state-of-the-art Orange County to count in their own states. We can’t tell how much it will affect any individual voter — but we can make some judgments in the aggregate.
The rule of thumb I’ve heard in politics is that polls overestimate Democratic candidate success by about 2-3% — meaning that Biden has to be leading by at more than that much in order to feel that he should win. (Of course, random error still exists — but that can balance out in the long term.
Of course, the Trump Administration and other Republican officials — and sadly, including much of the judiciary these days — are trying to add more systematic error in the one state — Pennsylvania — that Biden leads Trump by 5 points. If I adjust that towards Trump by 2.5%, it means that Biden has a 2.5% lead — just like the one he has in Florida — which gives him only a 2-in-3 chance of winning the state. (But I presume that they’ll pull out all the stops there — so maybe 4 points, bringing it to almost even odds?) Apply that shift to Omaha and it turns into around an 55% chance of winning. Apply it to Arizona and it turns into a 0.4% lead — and that “Pennsylvania-loss insurance” path has only about a 38% chance of succeeding. (That’s why I want to GOTV in Arizona!)
The good news is that with all systematic error accounted for, only random error remains — and that means that some big state — Florida?, Texas?, Georgia? — may pile on to Biden’s 258 floor.
But that’s with as estimated shift of 2.5%. What if the systematic error undoes a 3% lead? Or 4%? That’s what agitates me, and why I give Biden maybe a 60% chance to win. A big wind’s coming — but we don’t yet know its strength.
This is a long read, just under 3000 words, but it sets out why I forecast Biden having only about a 60% chance of winning rather than the 90-99% you’ll see elsewhere. It includes a pretty detailed critique of most election forecasters — who don’t get that voter suppression and ballot disqualification is a wave affecting MOST swing states — and that that systematic error has to factor into their calculations. People may THINK that they’re going to vote and have their ballots counted — but far too many of them will be wrong.
And that’s as terrible an indictment of our democracy as we’ve seen in years.
As I was finishing this post, without my knowledge until this morning, Nate Silver came on to 538 and admitted about 53.8492% of what I had been saying here: https://fivethirtyeight.com/features/im-here-to-remind-you-that-trump-can-still-win/