.
.
.

Map of Latino Population Density in Buena Part. (Rotated to fit page; NORTH IS AT THE LEFT.)
It’s unreasonable to ask Buena Park’s City Officials to read 3700 words on the City’s Districting process (available at that link) and the maps that are (or should be) under consideration. But here’s hoping that asking that they review this 865-word Executive Summary, along with some clicking that link to the larger story a few times if they want to look at maps or otherwise get more detail, is reasonable. (Unfortunately, this paragraph has already used 90 words.)
1. Buena Park’s Political Participation by Minorities is Woefully Low (and Will Be Through 2018)
City Population (2010): 40% Latino, 28% Asian, 26% Non-Latino White (“White”), 4% Black, and 2% other
Voting Age Population (2010): 36% Latino, 30% White, 28% Asian, 4% Black, 2% other
Citizens of Voting Age Population (“CVAP” or “Eligible Voters Pool”) (2010): 38% White, 29% Latino, 26% Asian, 4% Black, 3% other
Registered Voters (2012): 48% White (estimated), 31% Latino, 12% Asian-surnamed, 4% Black (estimated), 3% Filipino-surnamed, 2% other (estimated)
Voters Turning Out (2012): 51% White (estimated), 29% Latino, 11% Asian-surnamed, 4% Black (estimated), 3% Filipino-surnamed, 2% other (estimated)
Voters often choose candidates based on ethnicity. An at-large voting system means that Non-White candidates won’t tend to run because they don’t expect to win. And the lack of candidates of their ethnicity voting reduces Non-White voter turnout. District elections make it more likely that a Non-White candidate will run, if they live in a district with voters of their ethnicity, which will increase Non-White voting.
Because three of the four candidates who intend to see re-election were elected in 2014, they will probably remain on the City Council as “at-large” representatives until 2018. So significant changes aren’t likely until then.
2. Creating Only Four Districts Wouldn’t Generate Sufficiently Concentrated Non-White Voting Pools
[Note: Districts in Buena Park are likely to be numbered counterclockwise, from north to south on the east side and then from south to north on the west side.]
Ideally, a city with a minority population as high as Buena Park’s would have at least one majority Latino CVAP district (over 50.0%) and one plurality Asian CVAP district (probably over 40%). Failing to meet either benchmark, if doing so is shown to be possible, could attract litigation from underrepresented minorities.
Asians are primarily concentrated in the north (Los Coyotes) area, District 1. With 4 districts, it is hard to draw lines creating a solid Asian CVAP plurality there. With 5 districts, creating a 40%+ Asian CVAP plurality is pretty easy.
Latinos are primarily concentrated in the central, mostly east area, District 2. With 4 districts, drawing lines to create a Latino CVAP majority sacrifices both Asian CVAP in District 1 and compacteness, leaving a gerrymandered-looking map. With 5 districts, creating a majority Latino CVAP plurality can be done, though creating a good-looking map above about 49% Latino CVAP isn’t easy.
These reasons strongly suggest that the Council create 5 districts, rather than 4 districts and an at-large Mayor.
3. Looking at the Five-District Plans
Seven five-district plans were submitted. One of them (the “Diamond 5” plan is no longer suggested, leaving six. These are one plan submitted by “the Coalition” (notably LULAC and the Korean Resource Center); one by the NDC Demographers themselves; one by Val Sadowinski from the Los Coyotes area; and three by Greg Diamond (me), which are slight variations of the same basic plan, designated as 5A, 5B, and 5C. (My narrow preference is for 5C over 5B, but either much more than 5A.) The Sadowinski Map was left off of the “summary sheet” created by the Demographers, but its numbers are included below this graphic, in which the original Diamond Map is crossed out:
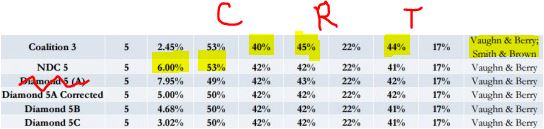
Columns marked “C” address Latino and Asian CVAP (respectively); “R” represents 2012 voter Registration numbers; and T is for 2015 voter Turnout.
Numbers for the Sadowinski Map are:
Districts: 5. Total deviation: 6.55%
District 2 Latino CVAP: 49%; 2012 Registration: 43%; 2012 Turnout: 42% (columns 4, 6, and 8)
District 1 Asian CVAP: 42%; 2012 Registration: 22%; 2012 Turnout: 17% (columns 5, 7, and 9)
The two lowest deviations from equality across district are Coalition 3 (2.45%) and Diamond 5C (3.02%). The highest of the six remaining are Sadowinski (6.55%) and NDC 5 (6.00%).
The highest Latino CVAP in District 2 belongs to Coalition 3 and NDC 5 (53%). The lowest are Sadowinski (49%) and Diamond 5A (listed at 50%, but reaches that only via rounding up). The remaining two maps, Diamond 5B and Diamond 5C, are both slightly over 50%.
The highest Latino Registration and Turnout for District 2 is in Coalition 3 (45% and 44%). Sadowinski is next highest (43% and 42%). Next is Diamond 5A (42% and 42%). The remaining three maps (NDC 5, Diamond 5B, and Diamond 5C) are all 42% and 41%.
Regarding Asian CVAP for District 1, Coalition 3 is the lowest at 40%. The other five maps are all at 42%.
Regarding Asian Registration and Turnout for District 1 all five maps have the same numbers (22% and 17%).
No map pits two incumbents intending to seek re-election against each other except for Coalition 3, which would place Smith and Brown in the same district. Brown’s next election is in 2016 and Smith’s is in 2018, but Brown could be elected in District 4 while Smith serves for two years at-large, but Smith could not run for District 4 in 2018 if Brown (or a challenger) already held the seat.
Worksheet tables (which have more detailed statistics for each district) for Diamond 5B and 5C, along with easy access to all proposed five-district maps and other graphics, may be found in the longer summary from this morning. The Council’s public hearing takes place at 6 p.m. Tuesday, December 8, in Buena Park City Hall, 6650 Beach Blvd, Buena Park, CA 90621.
UPDATE:
A majority of the Council announced early on that they would go with a 5-district map. They chose the 5-district map created by their Demographic firm, NDC. As with Anaheim, I considered my map better than the one they chose, but also consider the one they chose to be completely adequate. So good job, Buena Park City Council — and good luck with your elections! A few small points:
(1) Unlike Anaheim, they seem inclined to NOT have incumbents serve out the second half of their two-year terms. I’m not sure how that’s going to fly.
(2) There was some community support for a map by “The Coalition”: LULAC, OCCCO, and the Korean Resource Center. (The latter was a surprise because it had the lowest Asian plurality in the sole Asian CVAP plurality district.) But that map pitted two incumbents each other — turns out that Brown and Smith would have had to run against each other in 2016! — and so was pretty obviously a non-starter. It would have been very easy to create a map that didn’t do this and I’m surprised that they didn’t do so.
(3) There were three speakers for public comments — until suddenly, at the end. Then Charles Kim, husband of AD-65 Assemblywoman Young Kim, popped up to endorse (without using my name) any map not drawn by me. I was as crushed as you would imagine. But I guess that now he has had revenge on me for calling his wife “the Bigoted Buttkicker” and “Ed Royce’s Social Director” and continuing to point out her feebleness in the Assembly. The jokes on him, though, because (a) I’m happy with the outcome, (b) I’m happy to have been part of the push for a 5-district plan, and (c) the only thing that really bothers me from my critics is if someone shows up with soap and a bucket of water and meticulously washes my car. I HATE that!
In any event, here’s your winner:
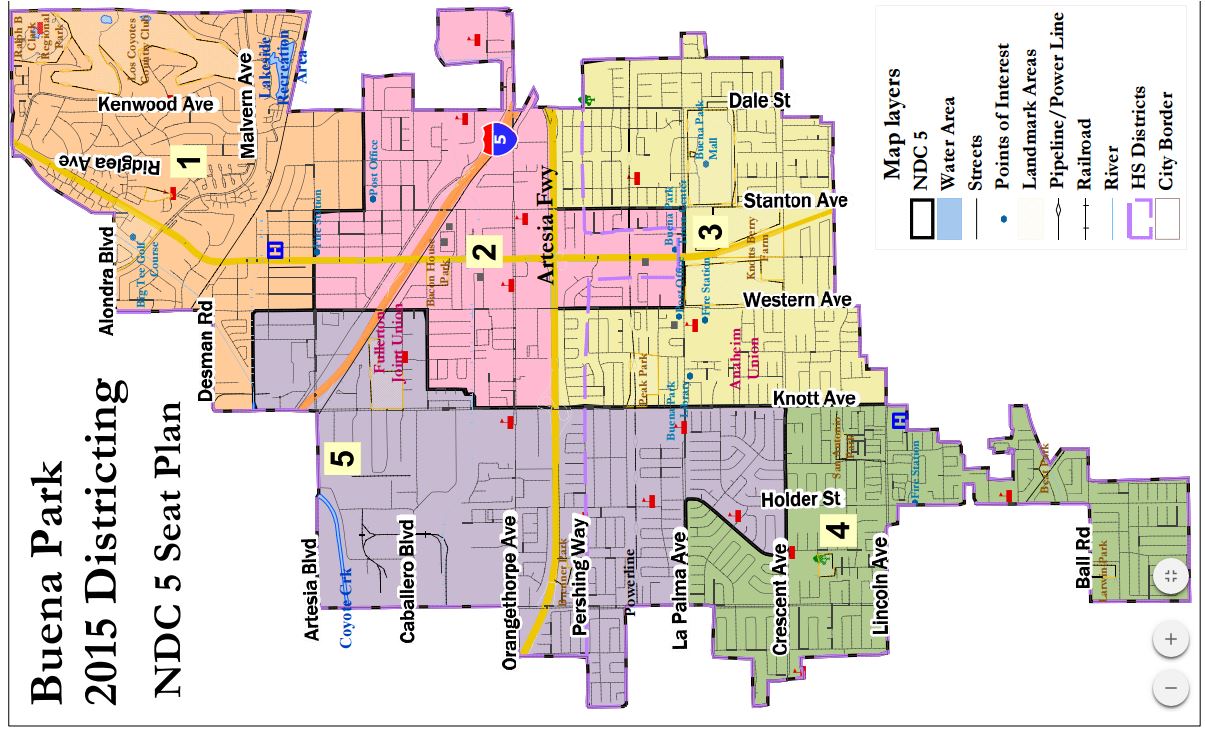
Demographers’ 5-district map. (Rotated to fit; NORTH IS AT LEFT.)
Note the Update! Buena Park’s chosen winner is … NDC Map 5! Congratulations to them and to the Council for making a good choice.